Climate change and city emissions

Climate change is also visible in Kuopio. A changing climate increases health risks, such as heat stress. Extreme weather events increase the load on buildings, roads and other environmental conditions.
Adaptation to climate change signifies preparing for risks and preventing the harms arising from change. Climate change is mitigated by reducing emissions. Carbon neutrality requires changes to energy production, industry, transport, housing and consumption.
Kuopio’s emission reduction targets
Kuopio’s goal is to be carbon neutral by 2030. Greenhouse gas emissions must be reduced by at least 80 percent by 2030 from 2007 levels.
Emissions are reported in carbon dioxide equivalent (CO2 eq.), which describes the climate-warming effect of different greenhouse gases. The amount of emissions to be reduced to achieve the carbon neutrality target is 542 kt CO2 eq. excluding industry. Including industry, the amount of emissions to be reduced is 663 kt CO2 eq. The share of the city organization’s own emission reductions is estimated at 173 kt CO2 eq.
In addition, the goal is to halve the consumption-based carbon footprint by 2030 from the 2005 level.
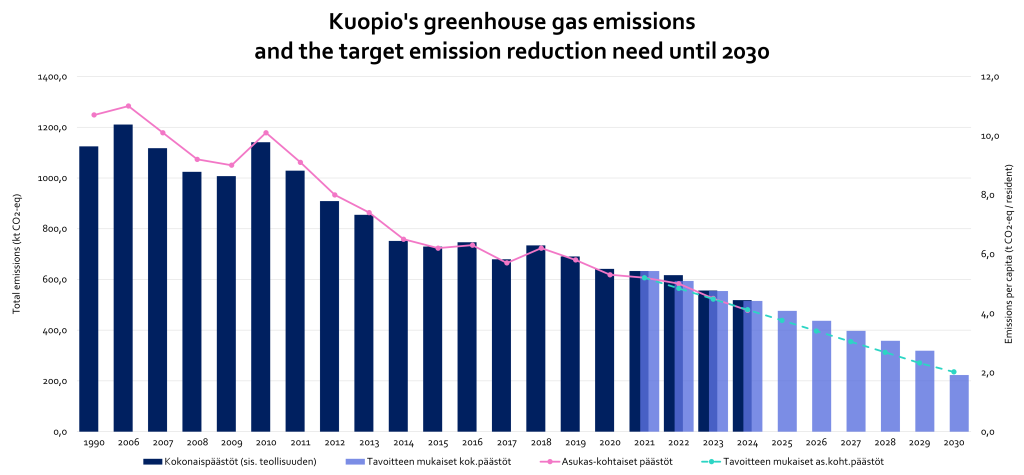
Image: Kuopio’s greenhouse gas emissions from 2006–2024, including industrial emissions and the emission reduction need according to the emission reduction target until 2030. Source: Kuopio CO2 Report 2025 / Sitowise.
Monitoring emissions that accelerate climate change
The city monitors greenhouse gas emissions through an annually published regional emissions report, CO2 report, and consumption-based emissions calculations.
By monitoring emissions trends, the city gains information about the effectiveness of climate measures. Monitoring helps in planning measures, allocating resources, and communicating climate work.
The most significant greenhouse gas emissions from the city of Kuopio can also be found in the weekly emissions graph.
-
The city regularly monitors greenhouse gas emissions through a CO2 report. The annual CO2 report covers emissions generated in the geographical area of Kuopio.
The emission calculation includes the following sectors: consumer electricity consumption, electric heating, geothermal heating, district heating, separate heating, road traffic, agriculture, waste management, industry and machinery, and industrial electricity consumption.
In regional emissions calculations, for example, emissions from agricultural production and product manufacturing within a municipality are included in the calculation regardless of where the products are ultimately consumed. On the other hand, many emissions indirectly caused by the activities of municipal residents are excluded from the calculation.
-
Kuopio monitors greenhouse gas emissions, or carbon footprint, caused by residents’ consumption. The calculation has been carried out for the years 2020, 2022 and 2024.
Emissions from consumption are divided into five sectors in the calculation: energy consumption, construction, transportation, food, and goods and services.
The calculation of greenhouse gas emissions from consumption includes all emissions resulting from residents’ consumption, regardless of the place of production. For example, emissions resulting from food and goods consumed by residents are included in the calculation, even if they are produced outside the city or Finland.
Regional and consumption-based emission calculation models partially overlap. Combining both calculation methods provides the broadest possible knowledge base on greenhouse gas emissions caused by the activities of the municipality and its residents.
-
Municipal and provincial emission data can also be found in the online services maintained by the Finnish Environment Institute (Syke):
- GHG emissions in Finnish municipalities and regions (SYKE)
- Consumption-based GHG emissions in Finnish municipalities and regions (SYKE, in Finnish)
- Scenario tool for the GHG emissions of municipalities (SYKE, in Finnish)
-
GHG emissions from the City of Kuopio can also be found in the weekly emission graph of the CO2 report (below), which includes the greenhouse gases with the highest climate impact, i.e. carbon dioxide, methane, and nitrous oxide. Emissions are reported in the tables as tonnes of CO2 equivalents by converting the impact of methane and nitrous oxide to reflect the climate impact of CO2 over a 100-year period. The emission calculation does not include industrial emissions. The weekly emission graph is updated automatically, and there is a slight delay in the information.
Adaptation to and mitigation of climate change
Climate change brings with it changes in weather and longer-term changes in climatic conditions. The changes have a wide-ranging impact on nature, the built environment, people and society. Adaptation aims to prevent or mitigate the negative impacts of climate variability and change and to benefit from the positive consequences.
Land use and infrastructure planning can influence the vulnerability of communities in the long term. Climate change mitigation and adaptation measures must also take into account the protection of biodiversity.
Increasing heavy rainfall increases the risk of stormwater flooding, especially in urban areas. This needs to be better addressed in stormwater management solutions with sufficient natural absorption and stormwater networks.
As the climate warms, humidity also increases. Humidity can increase mold problems in buildings and reduce the lifespan of buildings. Increasing slanting rain poses a risk to structures. The accumulation of moisture in structures must be prevented and adequate drying of the structures must be ensured.
Climate change can no longer be completely prevented, but its development can be curbed. Everyone can reduce consumption and emissions through their own choices and contribute to curbing climate change